
Practical Guide to Semantic Layers: From Definition to Demo (Part 1)
An introduction to semantic layers with a hands-on demo using the boring-semantic-layer library and a Streamlit app.

If you’ve spent any time in analytics, you’ve encountered this: Each team calculating “the same” metric slightly differently, leading to discussions about what is the “truth”, and not, how can we use the data to improve our business.
Marketing defines churn one way. Finance defines it another. Product builds its version. Before long, your company has five versions of churn, and no single truth.
A semantic layer is exactly the tool to prevent that chaos.
What is a Semantic Layer?
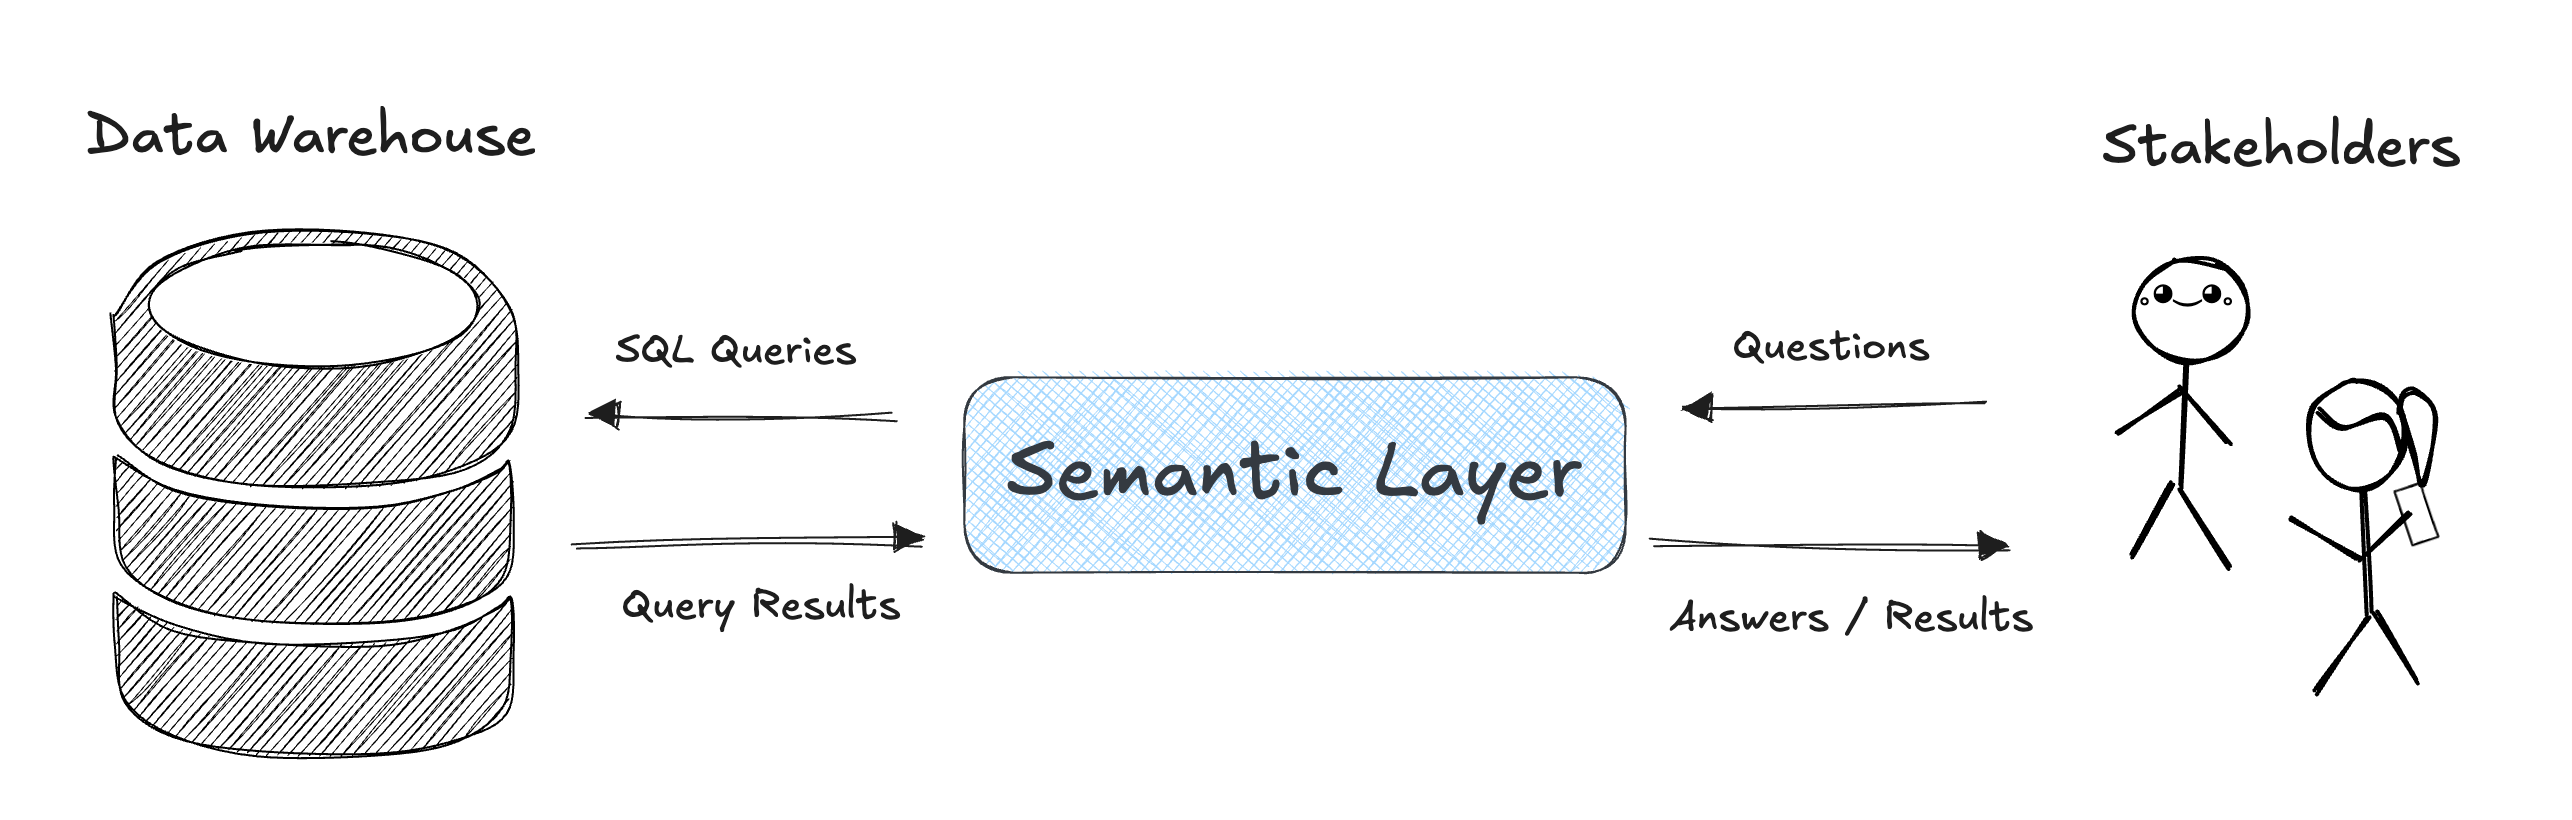
A semantic layer is a translation layer between “raw” data (tables, columns, SQL) and the language of your business. It hold information about which tables to use, how they relate to each other, which dimensions are available, and how to aggregate for a given metric. Effectively, it’s converting questions into SQL queries.
Once you define a metric or dimension in the semantic layer, everyone (dashboards, notebooks, APIs, AI assistants) can use it consistently.
The Changing Semantic Layer Landscape
The semantic layer space has been been around for ages, but it’s becoming more important than ever. Tools like dbt Semantic Layer, Cube, Malloy, Lightdash, and Boring Semantic Layer, are all aiming to unify metrics and definitions across BI and analytics. Snowflake’s Open Semantic Interchange (OSI) initiative is starting to shake things up by proposing a vendor-neutral standard for semantic models. This could make interoperability easier, push proprietary solutions to adapt, and open space for new tools that embrace the OSI framework potentially reshaping who leads in the semantic layer ecosystem.
Boring Semantic Layer + My Demo
To keep things lightweight and hands-on, I built a demo using the open source Boring Semantic Layer by Julien Hurault. In this demo it connects with DuckDB and lets you query lifecycle metrics without SQL. Because it’s built on top of the Ibis framework, you’re not limited to DuckDB the same interface works with a wide range of engines. You can run the exact same queries against warehouses like BigQuery, Snowflake, and Databricks, or even local engines like SQLite and Postgres.
I’ve folded this demo into my User Lifecycle repo (which you may recognize from my “Beyond MAU” series: Post #1, Post #2, Post #3).
The implementation has two main parts: the Python connection and model loader (semantic_model.py) and the YAML configuration (semantic_models.yml) that defines metrics and dimensions.
Check out the Github here:
Connecting to the Data
semantic_model.py uses Ibis to connect to our DuckDB database. The _load_tables() function loads the mart_user_state_monthly table, which contains precomputed user lifecycle states.
# simplified snippet
import ibis
from boring_semantic_layer import SemanticModel

def get_duckdb_connection():
    return ibis.duckdb.connect(”data.duckdb”, read_only=True)

def load_tables():
    conn = get_duckdb_connection()
    user_states_monthly = conn.table(”mart_user_state_monthly”)
    return {”user_states_monthly_table”: user_states_monthly}
Defining Metrics and Dimensions
Metrics and dimensions are defined in semantic_models.yml. For example, we define the user_state dimension, then a series of measures such as active_users, churn_rate, and pulse_ratio.
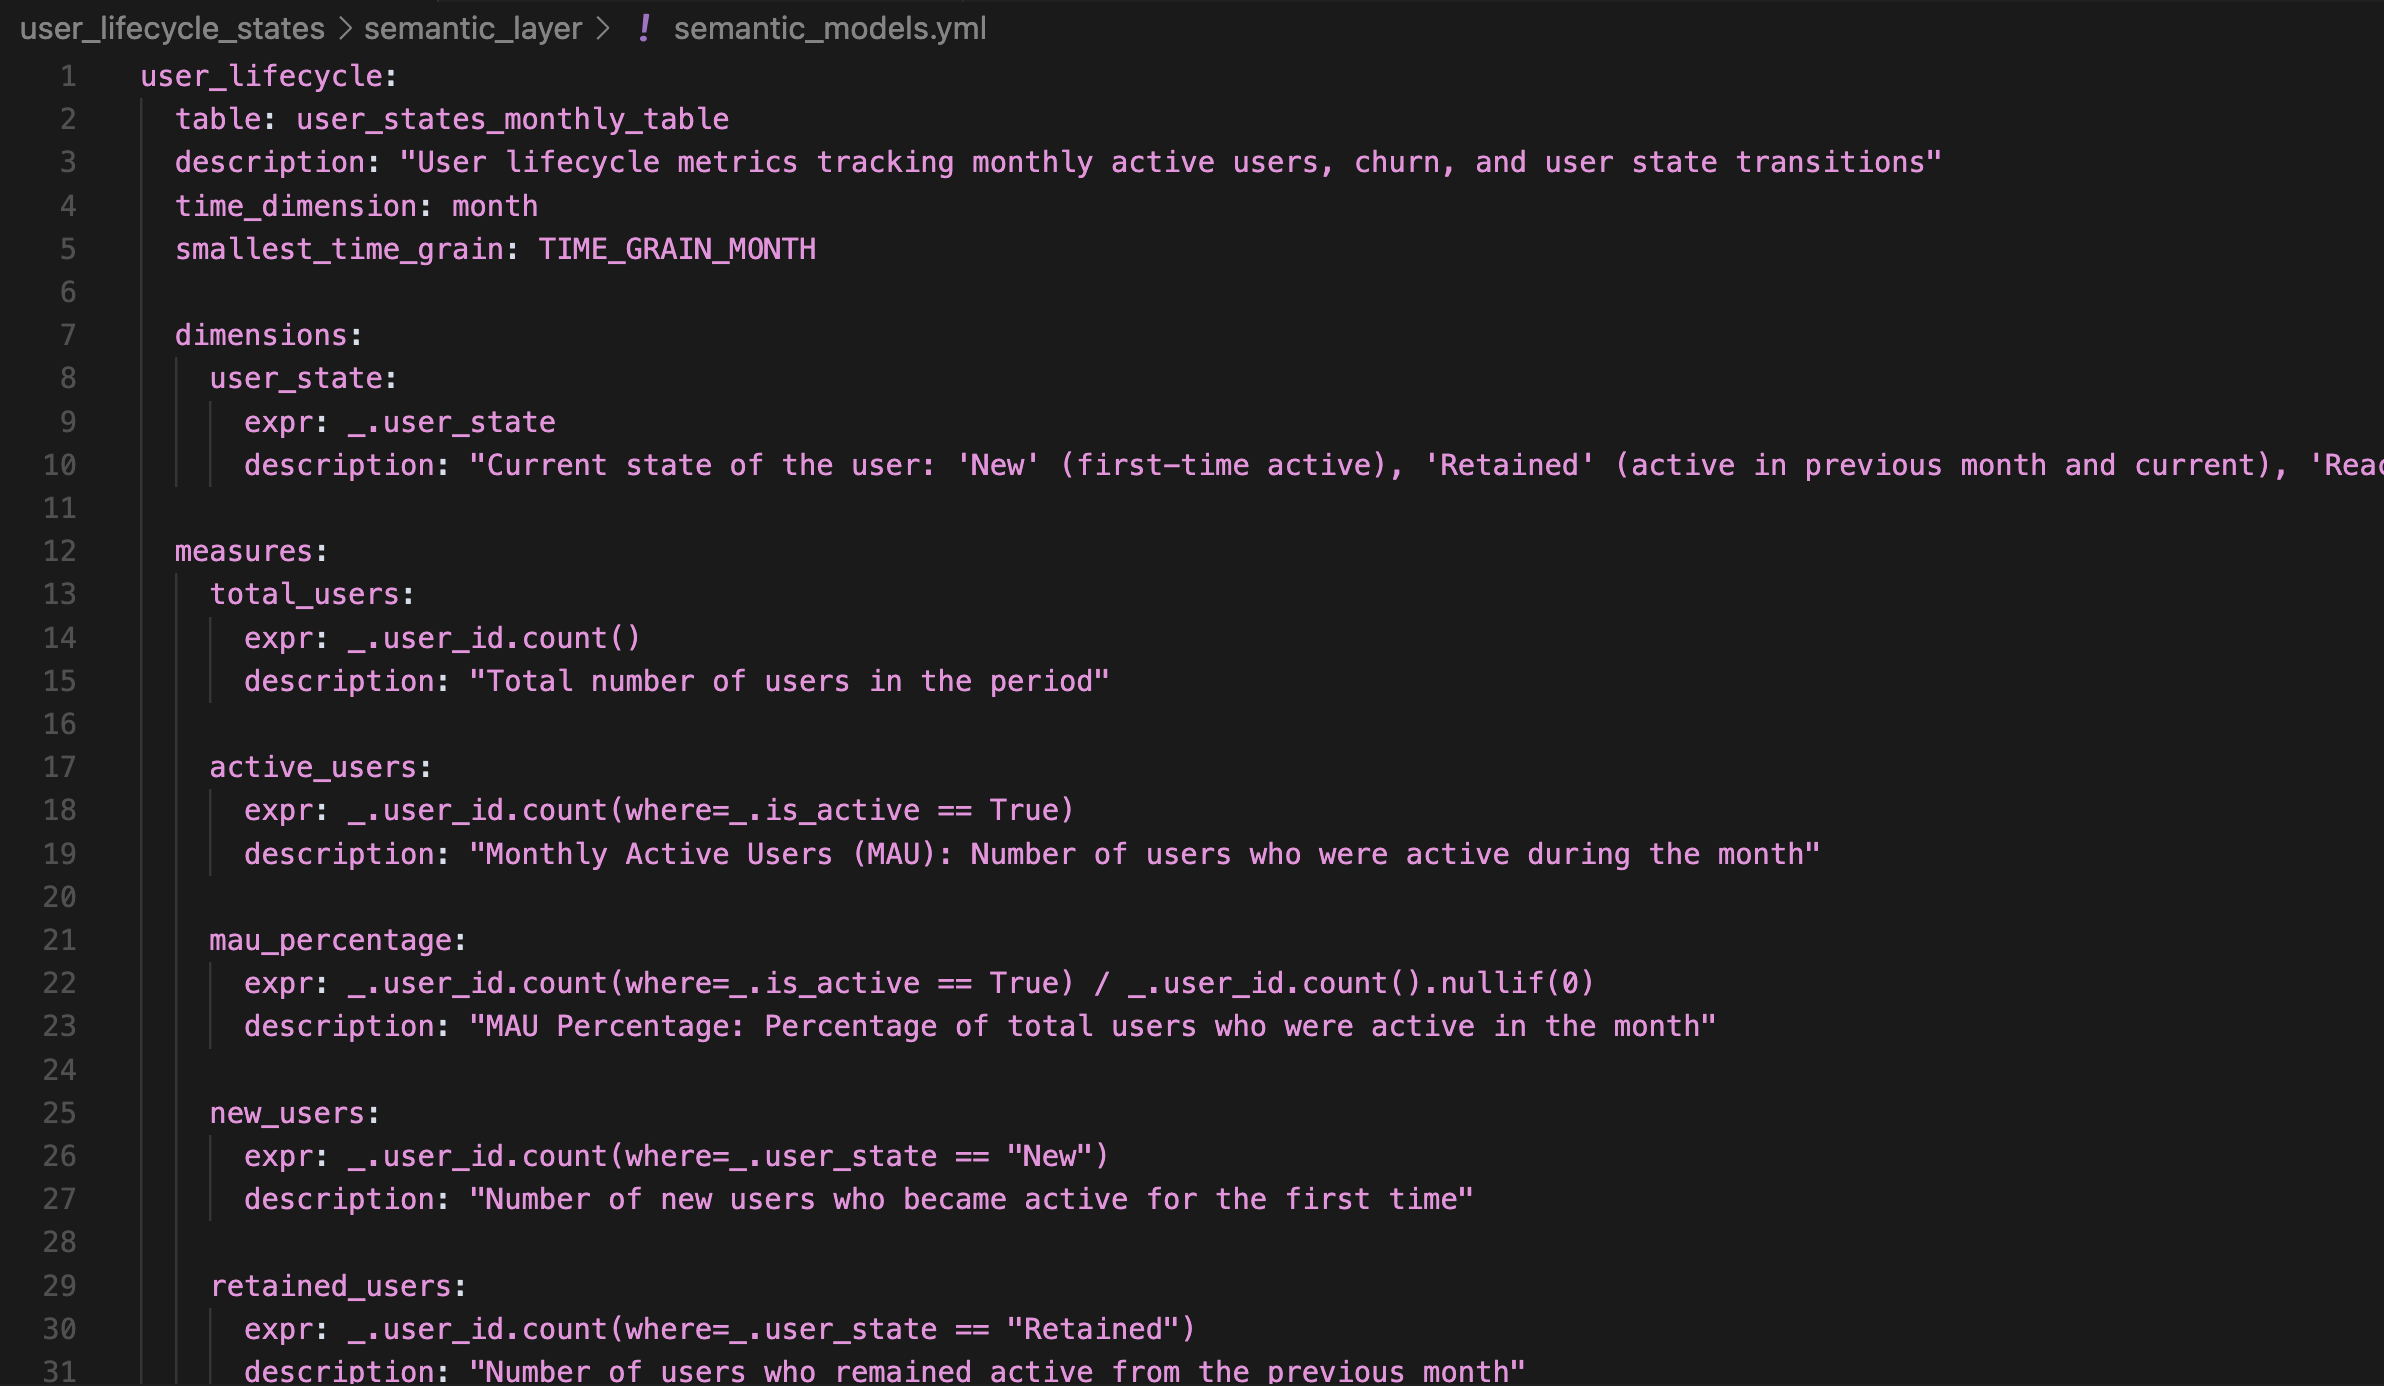
All logic lives centrally, so anyone querying the semantic layer, whether through a Streamlit app, an MCP server, or directly in Python, uses the same definitions.
Loading the Semantic Model
The function create_user_lifecycle_semantic_model() reads the YAML configuration and returns a SemanticModel object that you can query programmatically:
semantic_model = create_user_lifecycle_semantic_model()
result = semantic_model.query(
    measures=[”pulse_ratio”],
    dimensions=[”user_state”],
    time_grain=”TIME_GRAIN_MONTH”
).execute()
Demoing the Semantic Layer in a Streamlit App
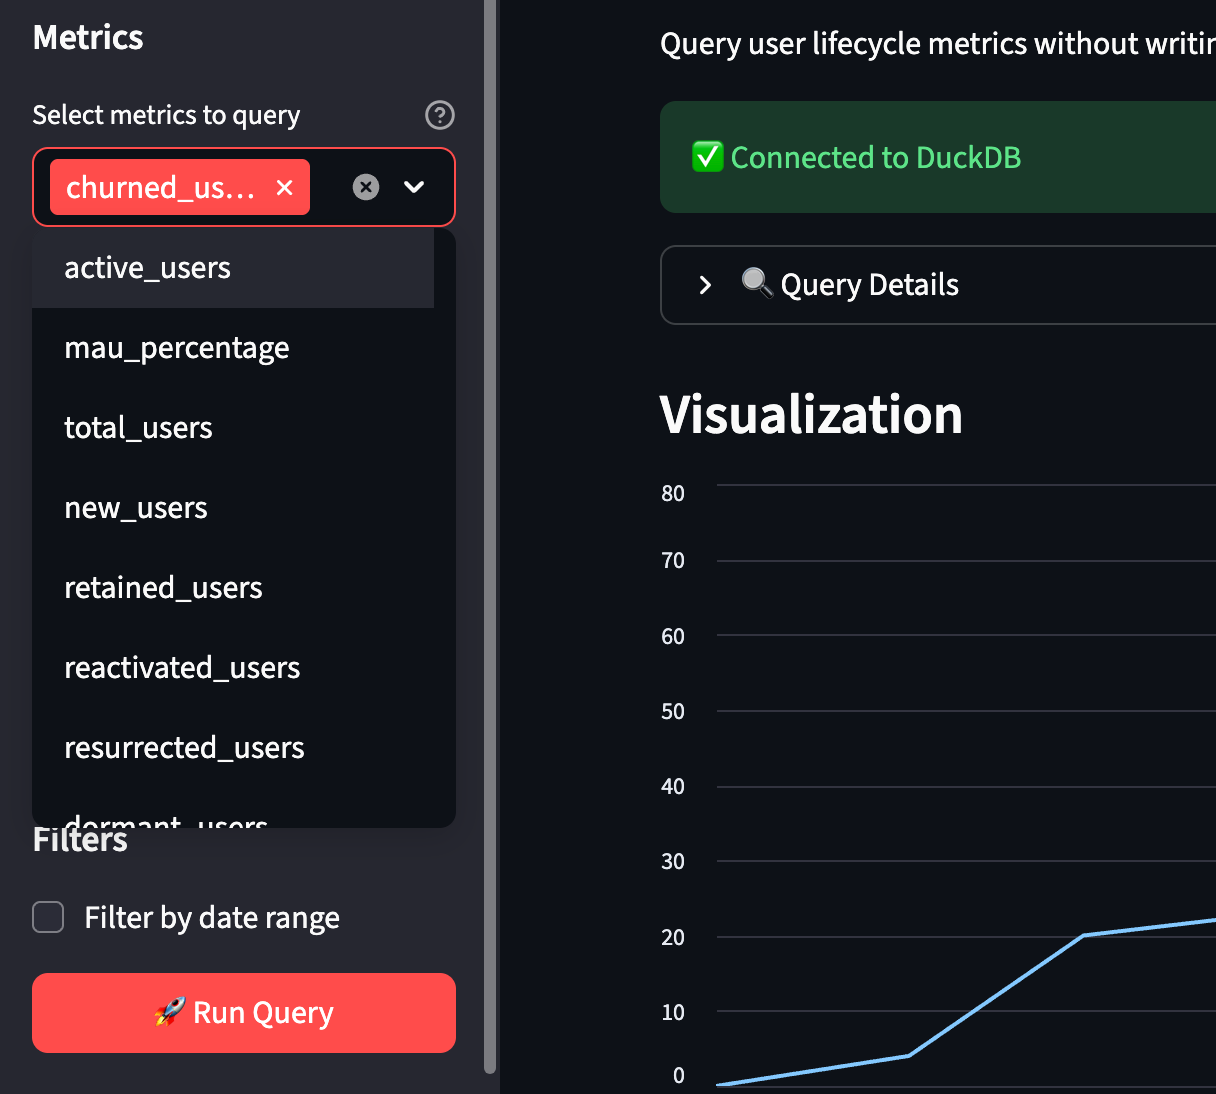
I create a Streamlit app that let’s you:
Choose from a list of metrics defined in the semantic layer (MAU, churn_rate, pulse_ratio, etc.)
Select time grain (month, quarter, year) and date range
View charts and the generated SQL (for transparency)
Selecting metric and time granularity:
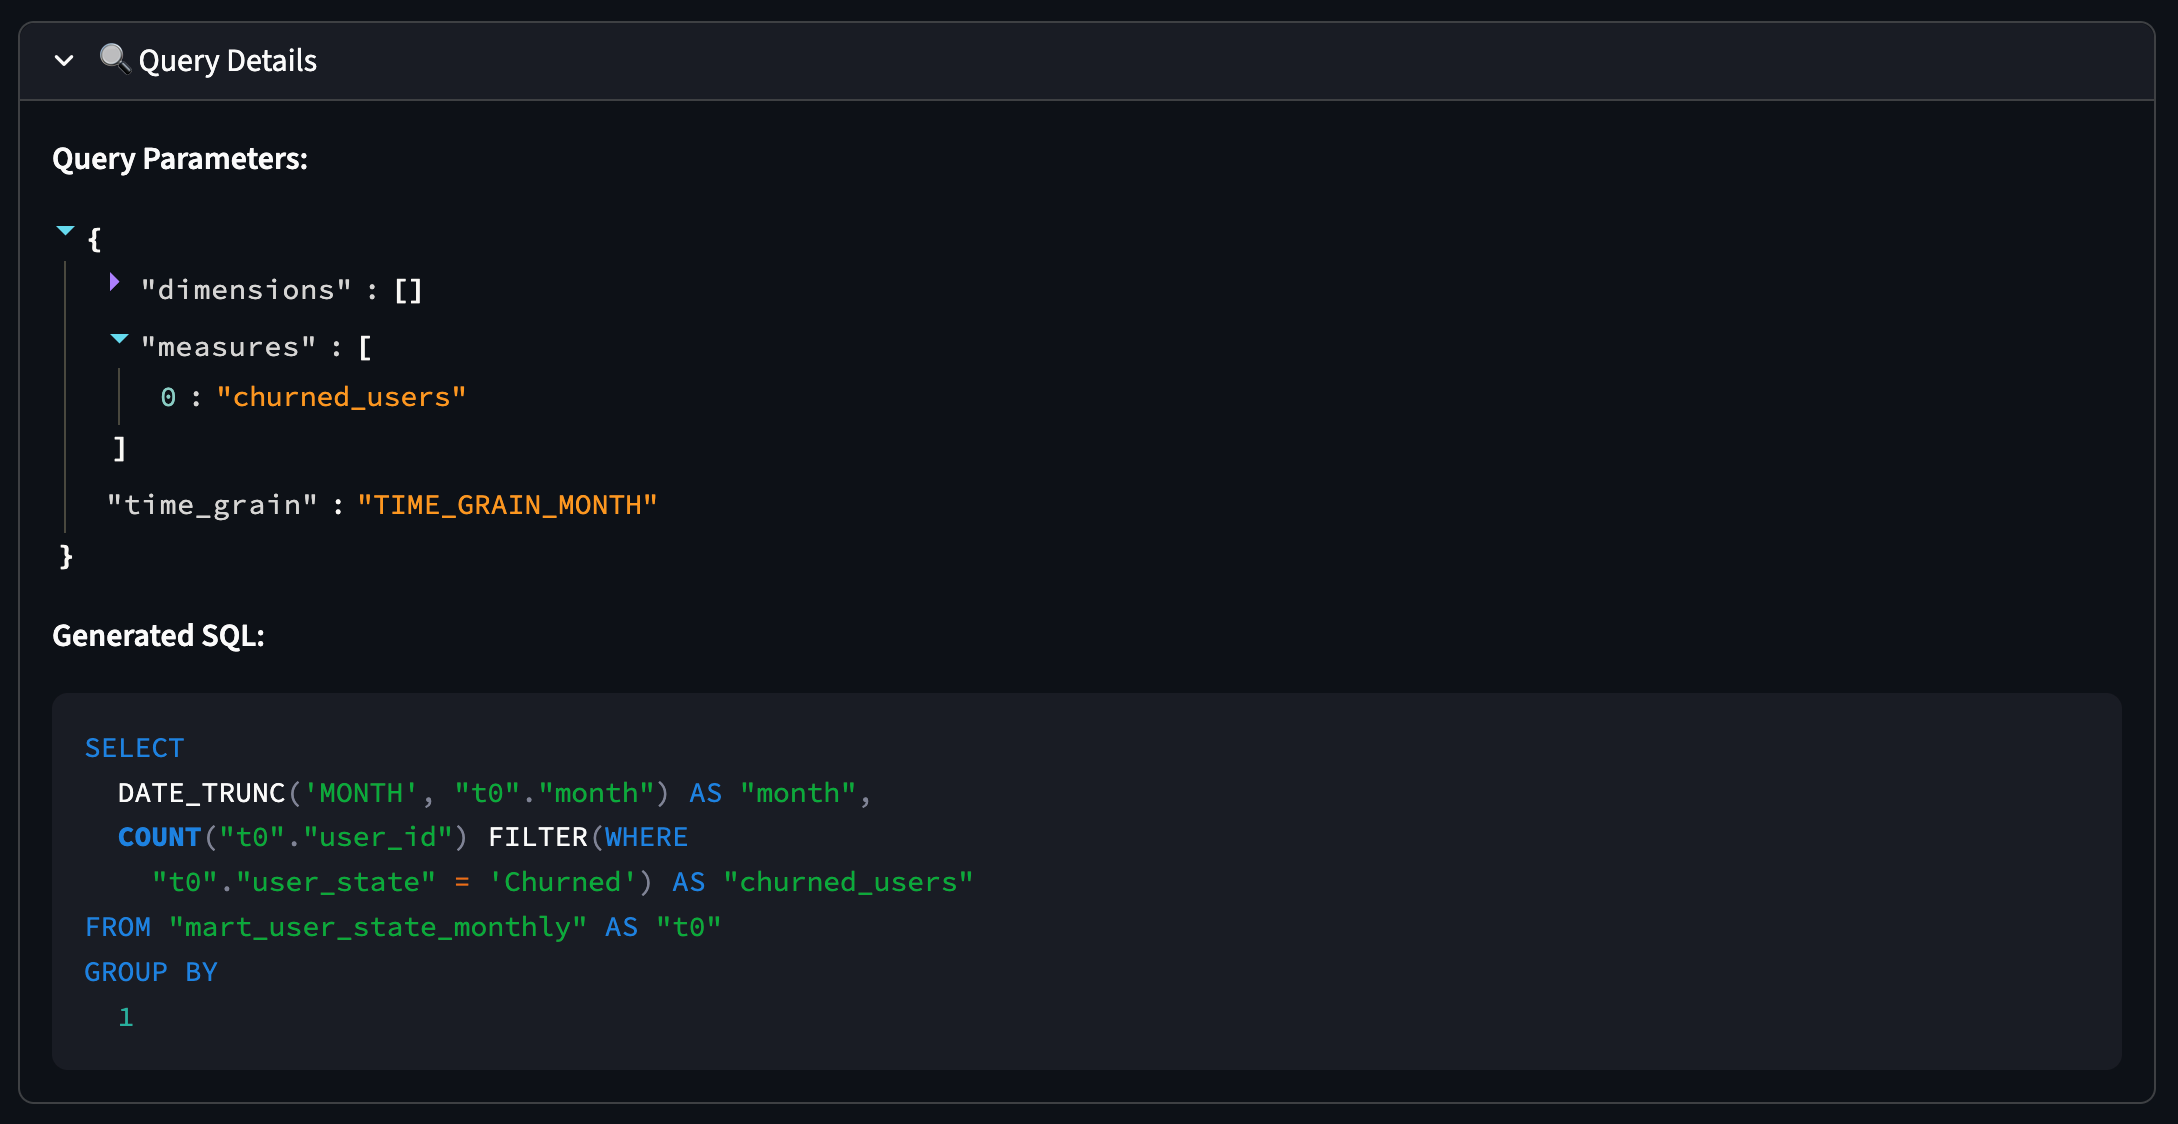
Inspecting the parameters and the generated query:
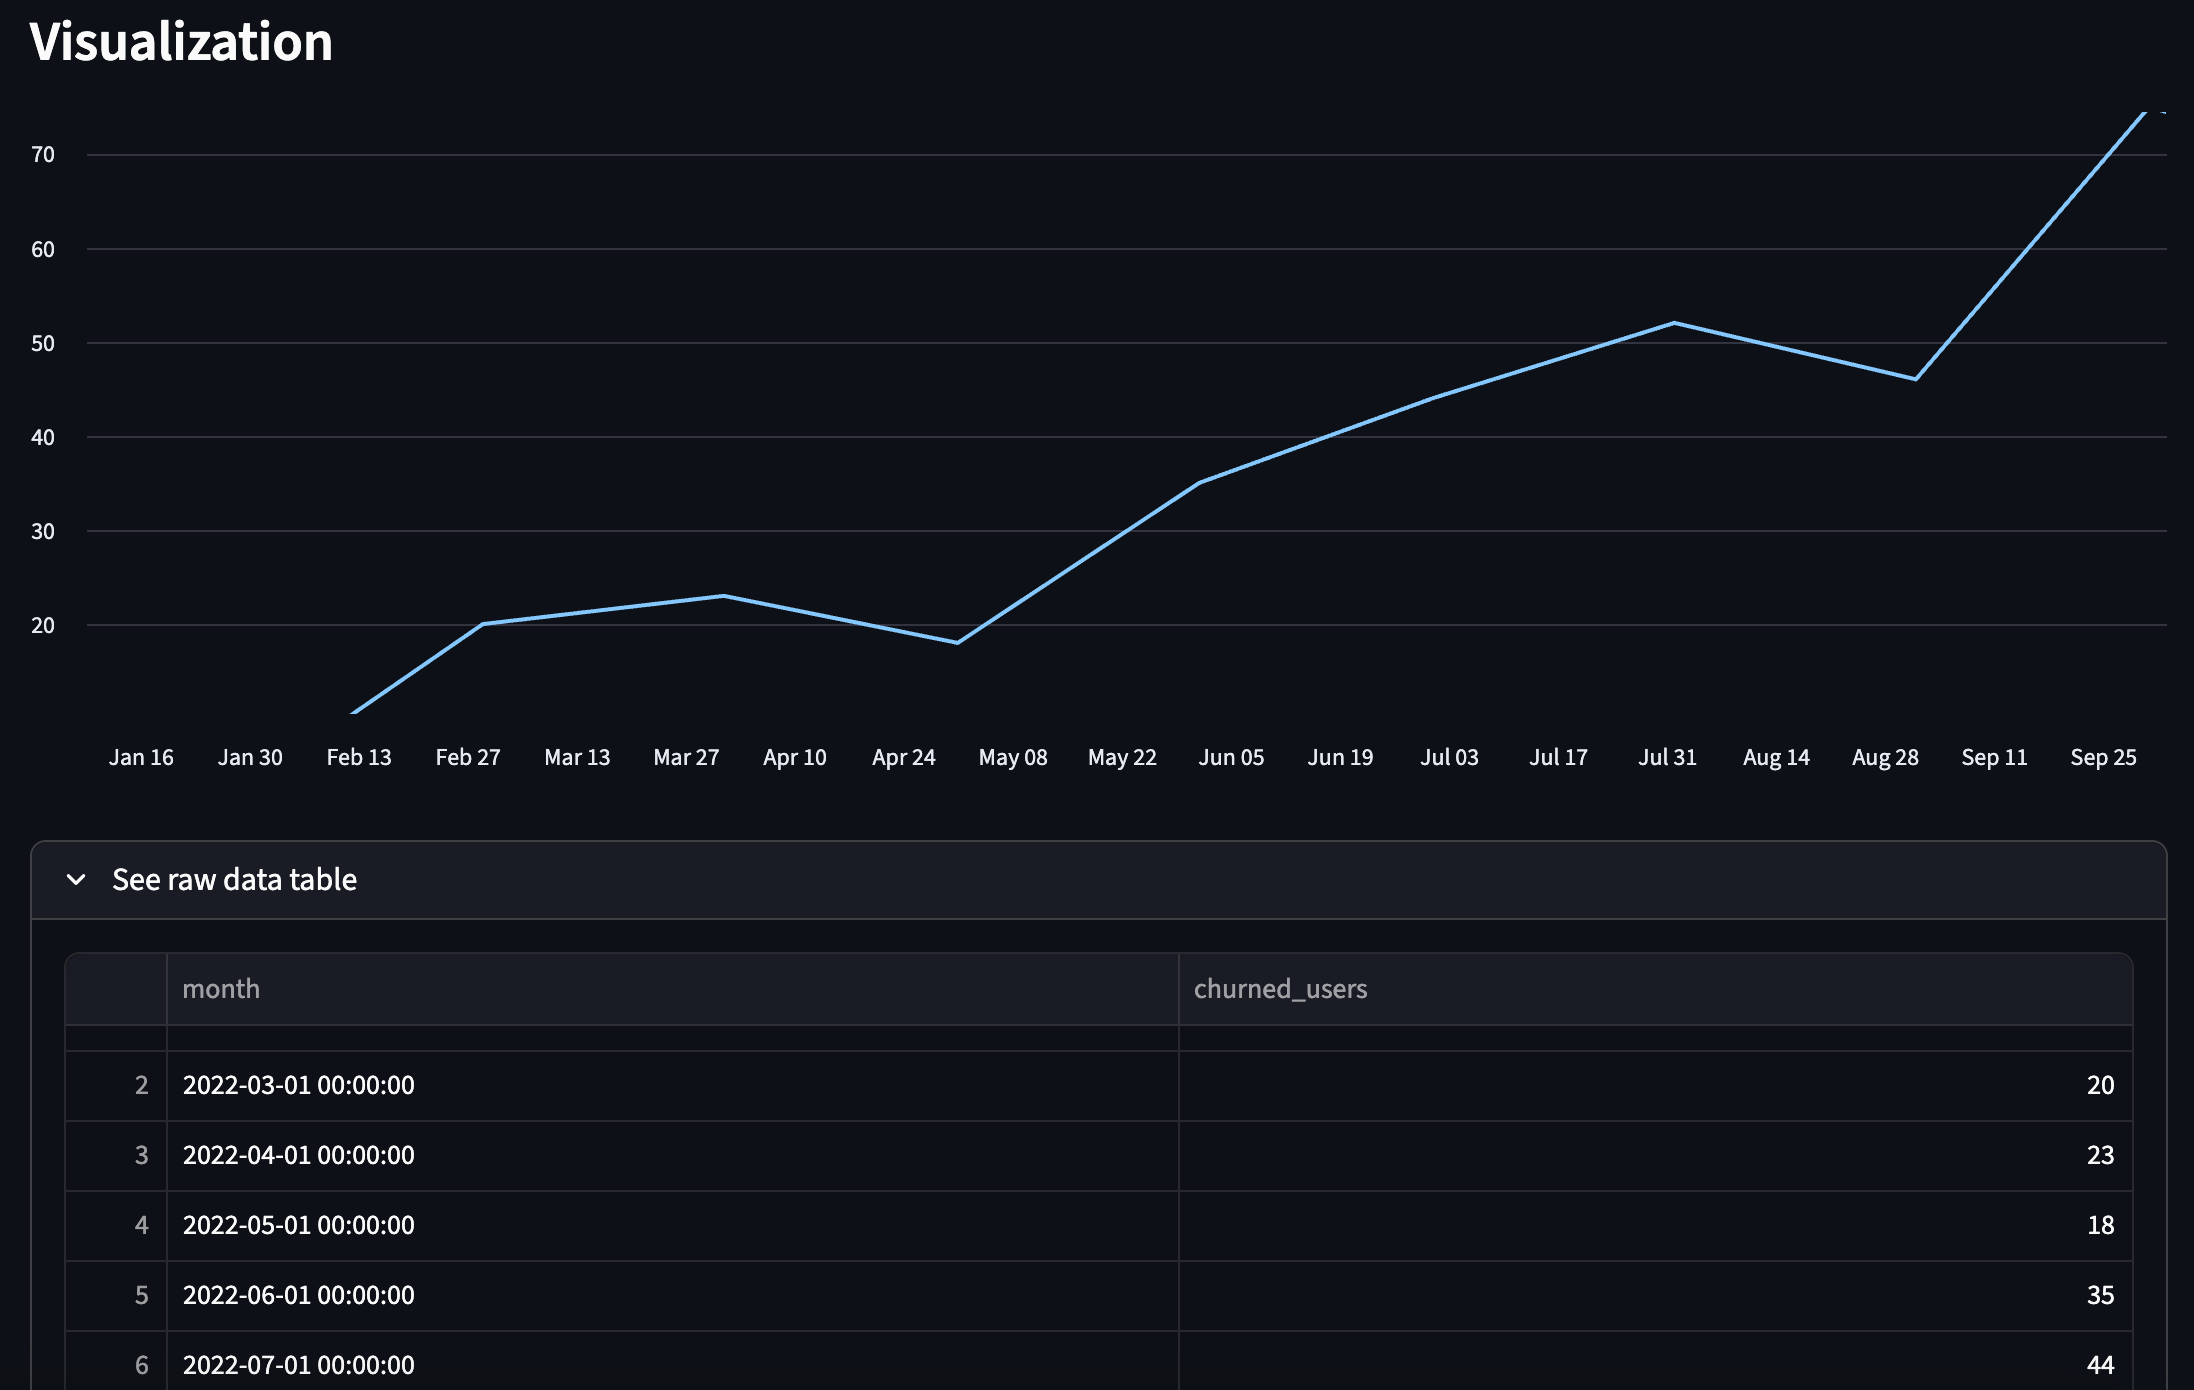
Output: Visualization and raw data table:
What’s Next
In Part 2, I’ll show how to take the semantic layer and expose it via an MCP server, so AI assistants (Claude, etc.) can query your semantic model directly, no SQL required.
Love the use of Boring Semantic Layer and Streamlit. Great stuff!
Thanks, Resmus. Your articles are very helpful.