
Beyond MAU: A Practical Framework for User Lifecycle States (Part 1)
A practical Product Analytics framework for mapping activation, retention, churn, and resurrection, so you can finally see the full story behind your active user numbers.

Check out Part 2 for the dbt modelling
Every product team obsesses over one question:
Are our users sticking around?
The trouble is, most companies answer this with flat retention curves or a DAU/MAU ratio that looks neat on a slide deck but doesn’t explain much. These metrics tell you if people are active, but not how they’re behaving across time.
That’s where lifecycle states come in. Instead of a single number, you get a map of user journeys, e.g. who’s new, who’s retained, who’s churned, and who’s coming back from the dead.
Working as a Product Data Analyst at Lunar (think Scandinavian version of Revolut/Monzo), together with my colleagues, we built a user lifecycle framework inspired by Amplitude’s Retention Lifecycle Framework and Duolingo’s growth model (check out
posts for other nice perspectives).Over time, it became a practical tool for aligning product, marketing, and leadership on the health of our user base, as well a a scaleable way for the data team to create a user definition (e.g. the adoption of a given feature, “high balance” users etc.) and monitor the usage dynamics of it.
Let me walk you through it.
Why Lifecycle States Matter
Think about a gym. At any given time, members fall into different categories:
Some signed up but never actually worked out.
Some came in last month and are still coming this month.
Some stopped showing up.
Some disappeared for months and suddenly returned.
If you only tracked “monthly visits,” you’d miss the richness of these stories. Lifecycle states give you those stories at scale for your product.
The User Lifecycle Framework
We look at a user’s state in a given month. The definition of “active” depends on the product.
At a challenge bank like Lunar, Revolut or Monzo, this could e.g. be MAU = did a transaction in the month.
Another company might define it as “logged in,” “created content,” or “had a subscription active.”
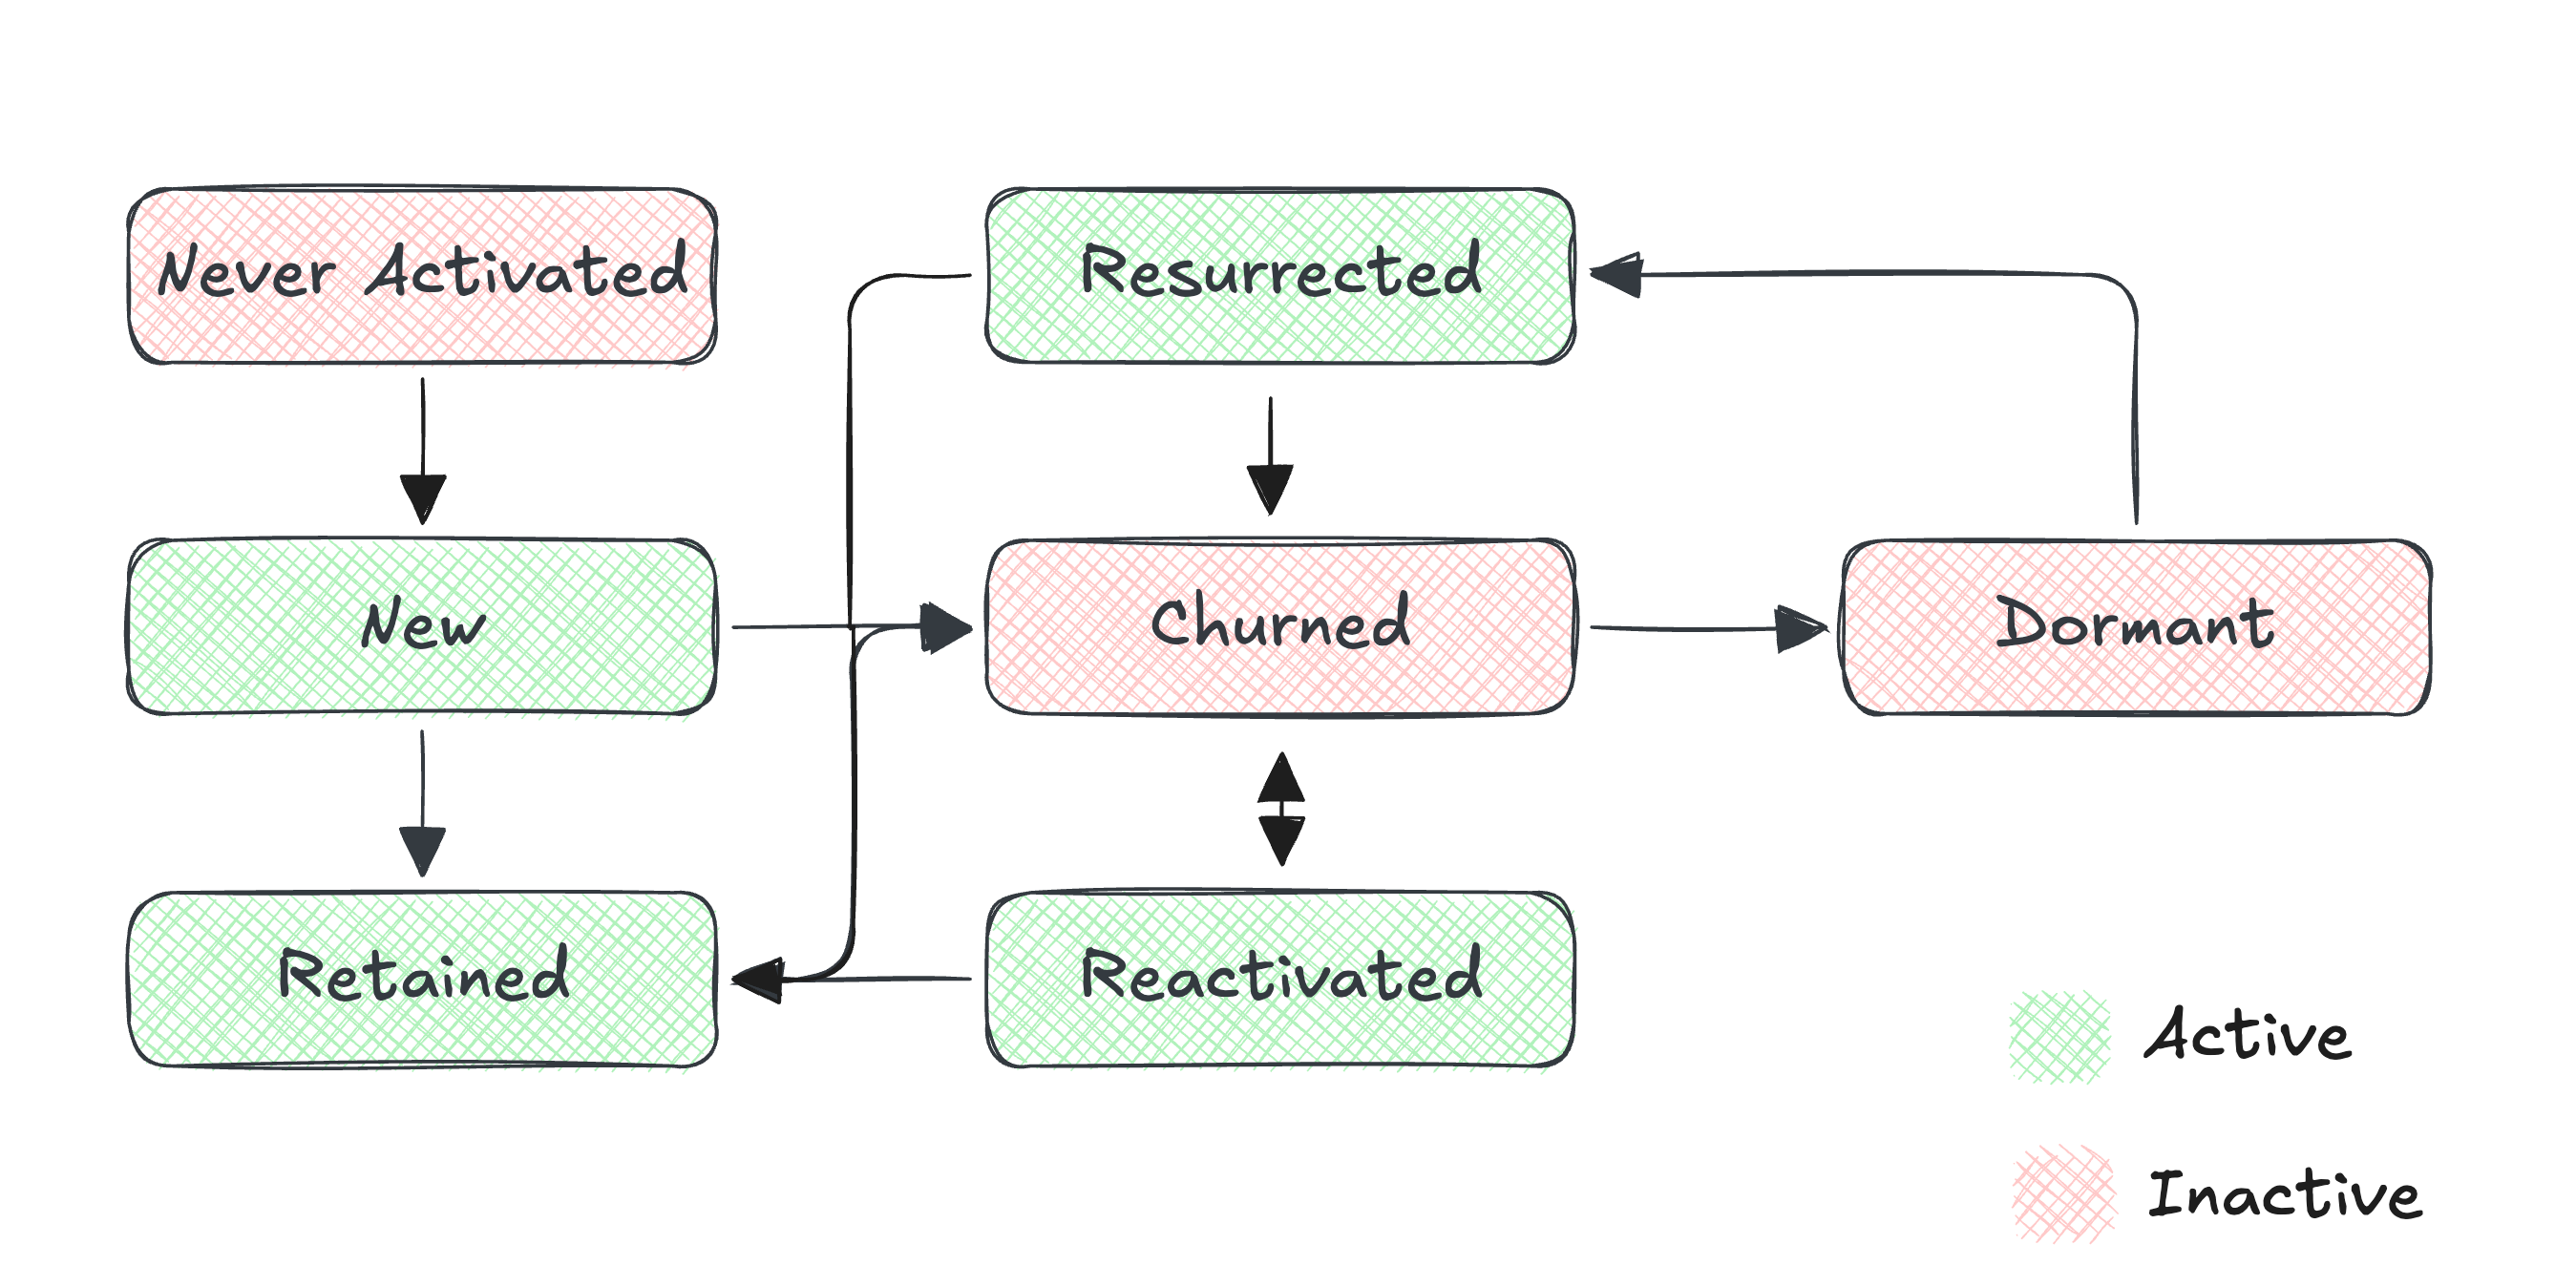
Once you’ve defined activity, every user falls into one of seven states:
Never Activated
Users who exist in your system but have never met the activity definition.
Example: someone opened a Lunar account but never made a transaction.
New
First-time actives in this month.
Example: they made their first-ever transaction in September.
Retained
Active last month and active this month.
The holy grail: consistent engagement.
Churned
Active last month but not this month.
The red flag that fuels your churn analysis.
Reactivated
Churned last month, but active again this month.
Think of it as a win-back campaign paying off.
Dormant
Inactive this month and inactive last month.
Potentially of long-term churned users.
Resurrected
Dormant last month, active again this month.
The long tail of users who come back after a break.
Here’s how the states connect:
How you define your activity unit/definiton, will impact the dynamics you observe later on. A usage/activity based definition like “making a transaction“ can be prone to large movements back and fourth between Churned and Reactivated, if the activity frequency is low (e.g. if it’s normal that a user only does a transaction every second month).
One way of mitigating this is to introduce an “At Risk” state, for users with one month of inactivity, which means you only deem the user as churned on their second month of activity
For non-activity based definitions like “had an account“, this dynamic will not show up in the same way.
Why “Given Month” Matters
We anchor states in a fixed period (usually monthly). That makes lifecycle analysis:
Comparable: You can track shifts month over month.
Actionable: Marketing and product can plan campaigns on a monthly cycle.
Scalable: Works across millions of users without overcomplicating definitions.
Depending on the product it might of course make sense to look at this on a daily, weekly, quarterly or yearly basis, but in most of the cases I’ve been involved with, monthly has been the most suitable.
Making It Practical
The beauty of lifecycle states is how easy they are to explain across the company.
Marketing: “We reactivated 5,000 churned users through this email campaign.”
Product: “Our new onboarding improved the New → Retained conversion by 12%.”
Leadership: “Our net growth came more from resurrected users than new signups.”
A lifecycle view gives everyone the same language. Instead of arguing about MAU vs. DAU, you’re asking: How many users are moving from New to Retained? How many are slipping into Dormant?
A Simple Example
Imagine you have 100k users. Your definition of “active” is “did a transaction.”
10k made their first transaction this month → New
40k were active last month and this month → Retained
15k were active last month but not this month → Churned
5k churned last month but came back → Reactivated
20k have been inactive for 2+ months → Dormant
3k came back from long-term inactivity → Resurrected
7k have never transacted → Never Activated
Immediately, you see the shape of your user base. Retained is your solid core, but Churned and Dormant are bigger than you’d like. This is richer and more actionable than just saying:
“We had 58k monthly active users.”
Key Takeaway
Lifecycle states turn abstract retention into a concrete map of user behavior. They help you spot where to invest:
Fix onboarding to reduce Never Activated.
Improve core loops to boost New → Retained.
Run win-back campaigns to convert Dormant → Resurrected.
In Part 2, I’ll show you how to actually build lifecycle states in SQL and dbt, step by step, so you can move from theory to a working model in your own warehouse.
These models will make it easy to calculate metrics such as Churn %, Reactivation %, Pulse Ratio, Adoption % etc. which we will cover in Part 3.