
Practical Guide to Semantic Layers: Your MCP-Powered AI Analyst (Part 2)
Exposing your semantic layer through an MCP server so AI assistants like Claude can query your metrics directly, no SQL required.

In Part 1 of this series, we built a working semantic layer using the open source Boring Semantic Layer, hooked it up to DuckDB, and explored it interactively through a Streamlit app.
In this post, we’ll take it a step further, by exposing that same semantic layer through an MCP server (Model Context Protocol).
That means your AI assistant (like Claude) can now access your metrics directly, interpret business definitions, and run consistent queries, without ever writing SQL.
Demo
In this demo, Claude translates a natural language question into a semantic query, fetches results from DuckDB through the boring-semantic-layer, and returns the answer to the posed question using your business definitions exactly as defined in YAML.
In this case, it failed to get the rendered chart from the MCP directly, so instead it built a React frontend to visualize the returned datapoints on the fly 🤯
Why This Matters for the Future of Data + AI
If LLMs are going to become reliable copilots for analytics, they can’t just “guess” what your metrics mean.
They need to know exactly what churn_rate, active_users, or pulse_ratio represent, i.e. which columns they’re derived from, how to aggregate them, and what time grain to use.
A semantic layer provides this shared vocabulary.
By exposing it through a Model Context Protocol (MCP) server, you’re giving AI assistants direct, governed access to that semantic model, so they can safely translate business questions into real, trusted queries.
In short: a semantic layer + MCP = a bridge between your data warehouse and your AI assistant.
The Architecture
Here’s what we’re building:
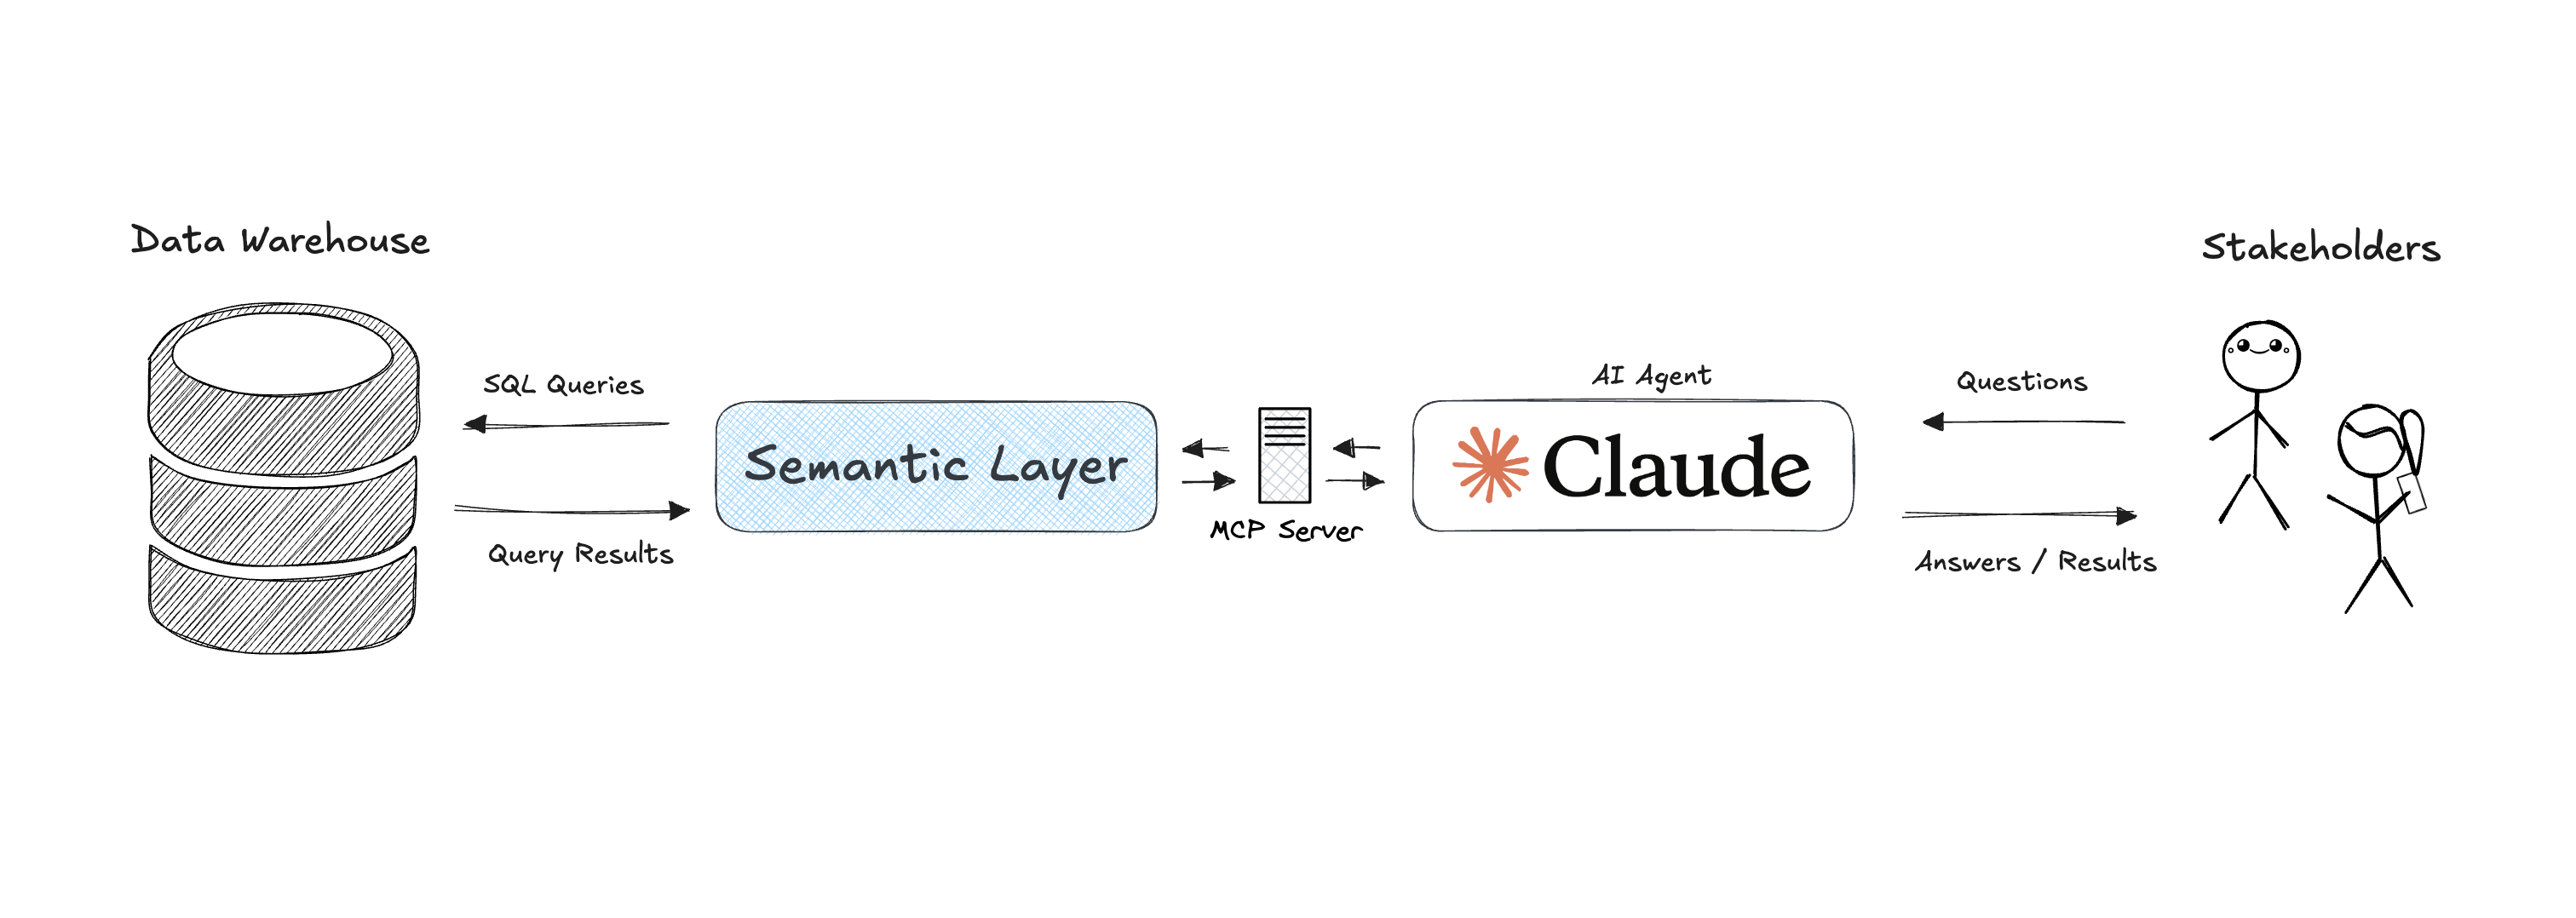
The MCP server is the piece that makes your semantic model queryable through standardized interfaces.
So instead of “SELECT COUNT(user_id) FROM …”, Claude (or any AI using MCP) can ask:
“What was the churn rate by user state last quarter?”
…and the MCP server will return structured data using your exact metric definitions.
⚙️ Implementation Overview
We’ll use three components:
semantic_model.yml: defines metrics and dimensions (Check Part 1)semantic_model.py: defines and loads our user lifecycle semantic model (Check Part 1)mcp_server.py: creates and runs the MCP server using that model
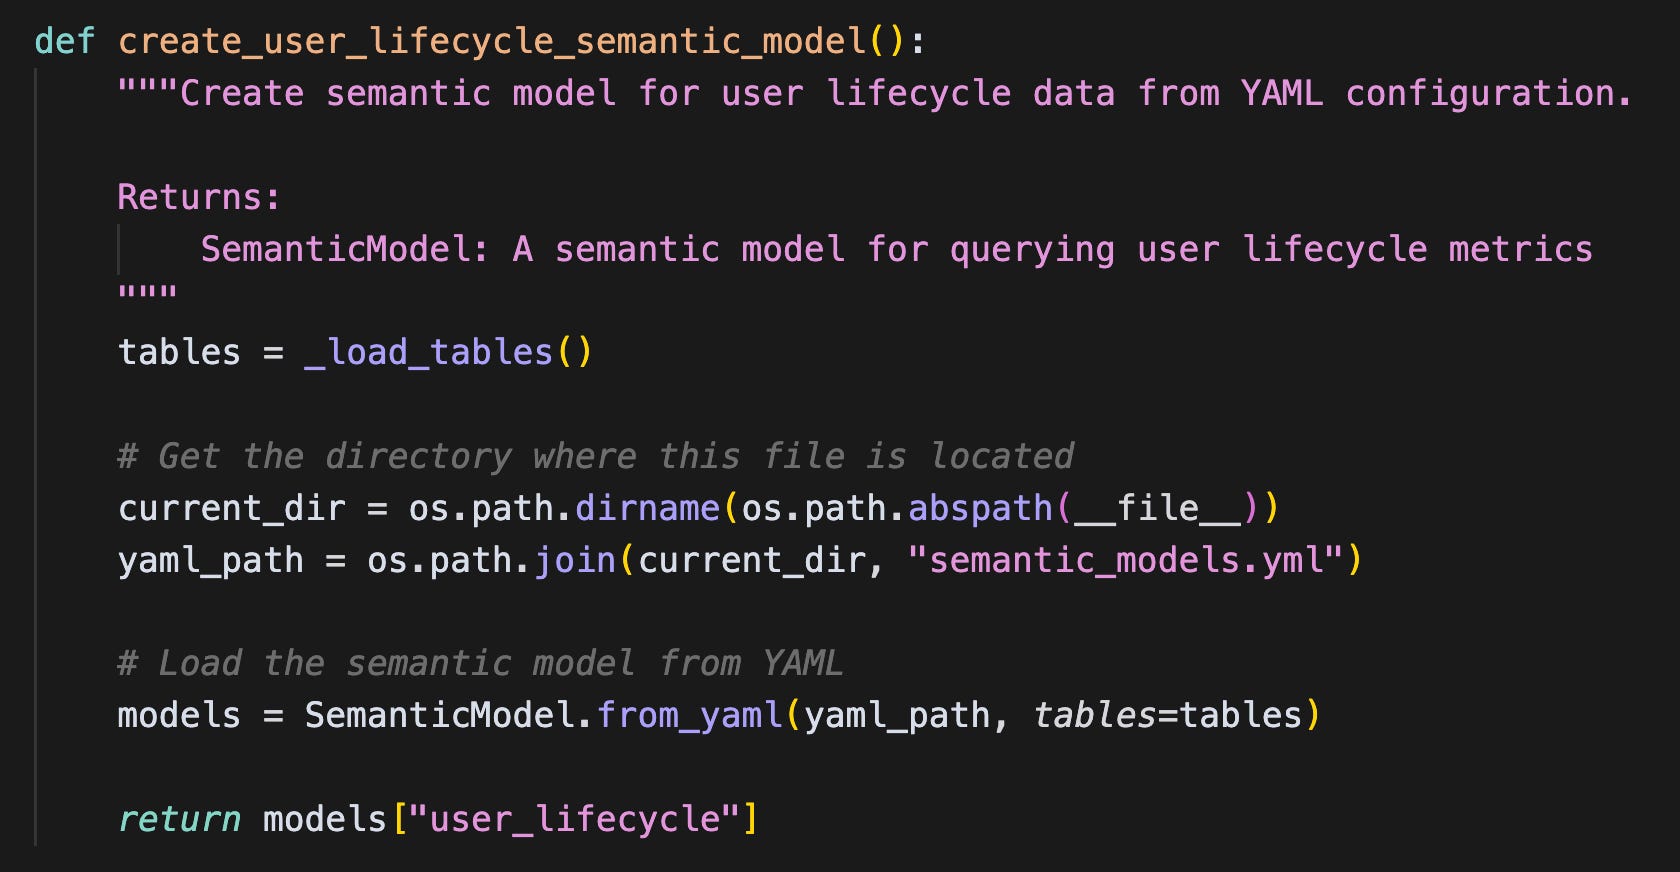
semantic_model.py (recap)
This file handles connections, table loading, and model definition.
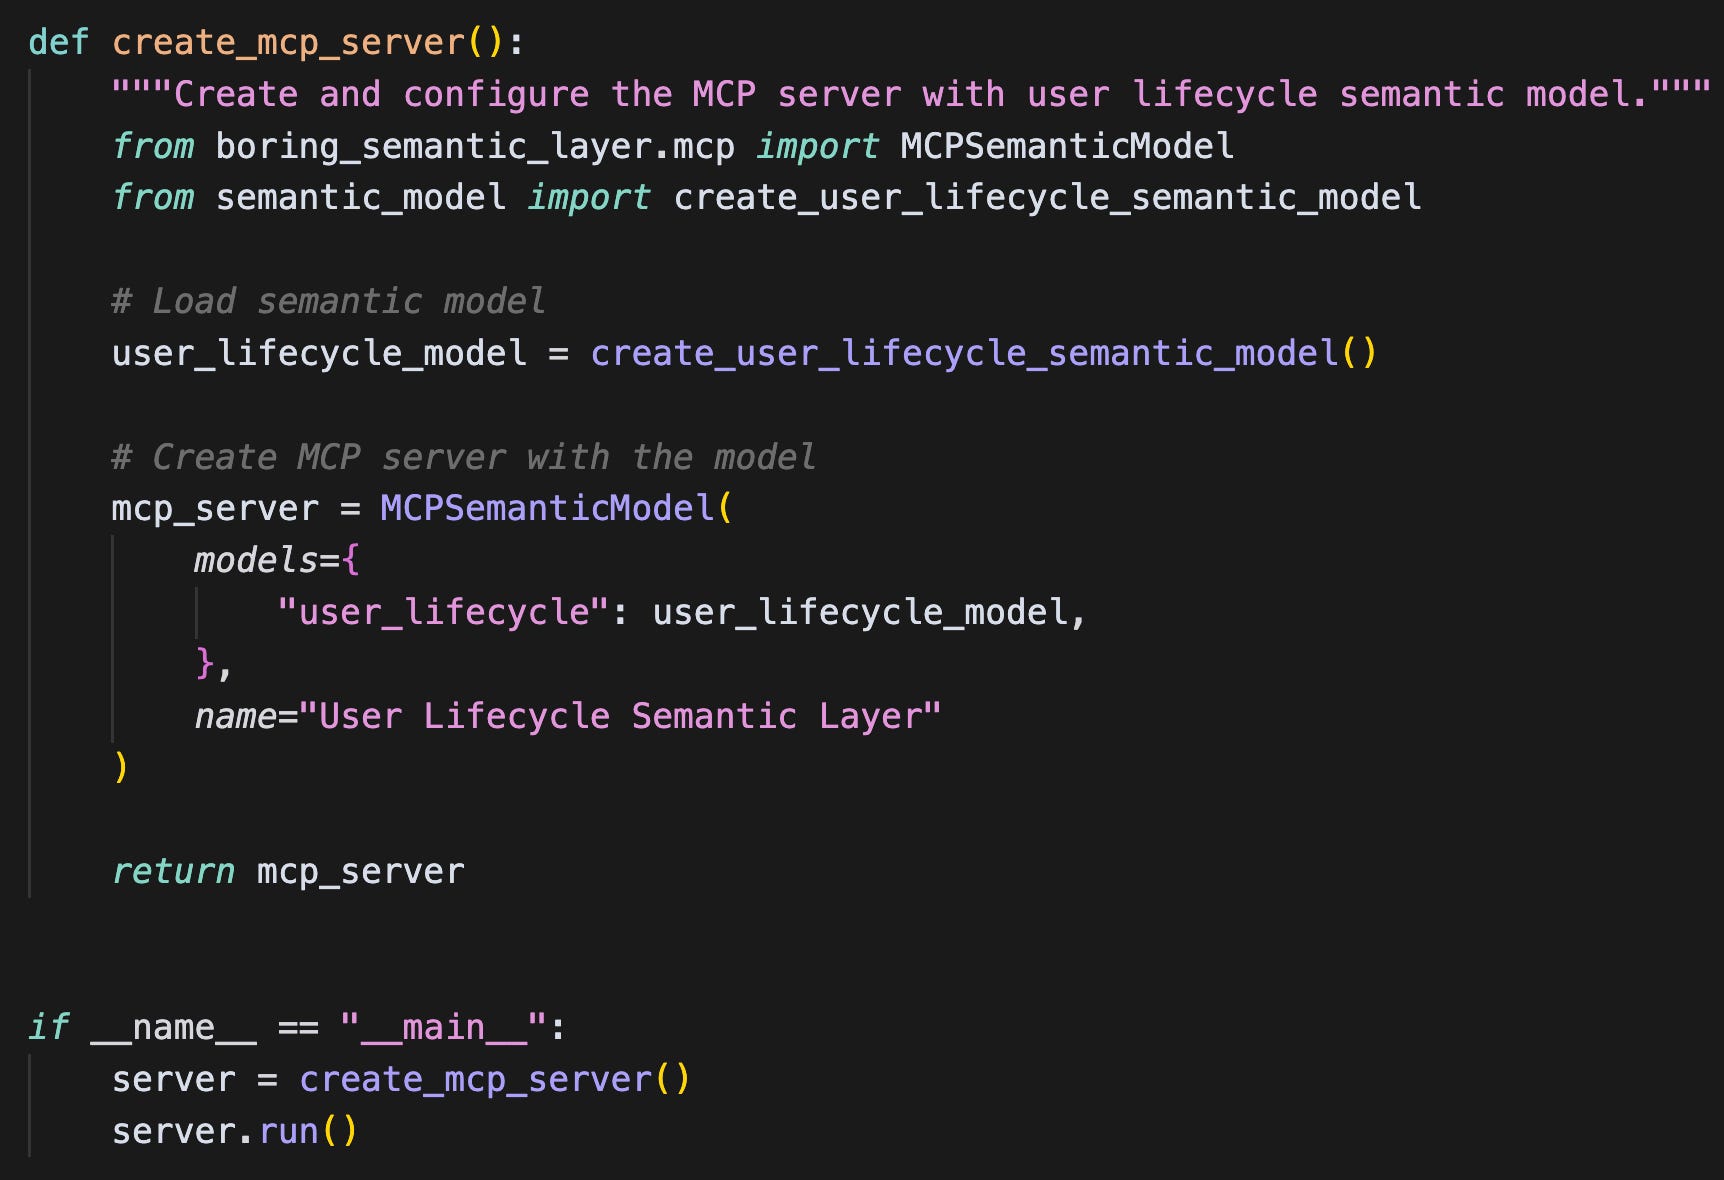
🚀 mcp_server.py
This is the new piece. It wraps the semantic model in an MCP-compatible server so that external agents can query it.
💬 Connecting It to Claude Desktop
Claude Desktop supports custom MCP servers directly.
To connect, add this to your Claude configuration file:
{
  “mcpServers”: {
    “user-lifecycle”: {
      “command”: “/absolute/path/to/.venv/bin/python”,
      “args”: [”/absolute/path/to/user_lifecycle_states/semantic_layer/mcp_server.py”]
    }
  }
}
Restart Claude Desktop, and you’ll see your “User Lifecycle Semantic Layer” appear as a connected data source.
Now you can literally ask:
“What’s our pulse ratio trend since last year?”
“Show churn rate vs retained users over time.”
”Visualise number of active users and active % as a bar and line combo chart”
All without writing SQL and fully governed by your semantic definitions.
Why This Is a Big Deal
This isn’t just a neat hack it’s a foundational shift in how analytics teams will interact with AI.
Semantic layers turn your data into a structured knowledge interface.
Combined with MCP, that interface becomes machine-readable allowing LLMs to access data responsibly, interpret context, and reuse business logic rather than generating new SQL each time.
The end goal is to have LLMs, BI tools etc all interfacing with the same semantic model, ensuring that no matter where your stakeholder pose their question, they get the same result.
STAY TUNED! In my upcoming Metric Tree 🌳 series, I’ll show you how to combine the same semantic model to a super neat interactive metric tree.